Why we care about aquatic nitrate levels
It isn’t just oil spills or plastics that cause the most silent damage — it’s the slow, steady rise of nitrates that turns life-filled waters into suffocating green zones.
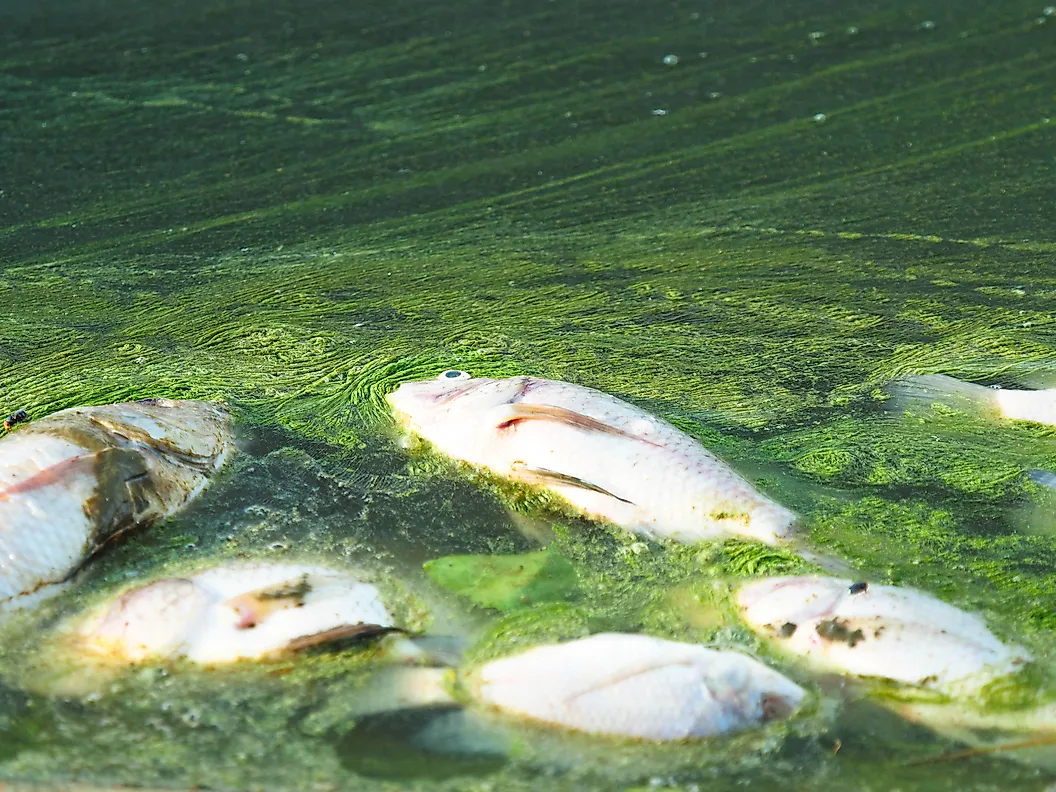
Eutrophication occurs when excess nutrients (especially nitrates) accumulate in water bodies, triggering dense algal blooms. These blooms block sunlight, deplete oxygen levels, and suffocate aquatic life. Over time, the ecosystem becomes imbalanced and biodiversity declines.
Nitrate buildup is a major driver of eutrophication. High nitrate levels often result from agricultural runoff, wastewater discharge, and industrial pollution. Once in the water, these nutrients can persist, making it difficult for ecosystems to recover even after pollution sources are reduced.
Continuous monitoring could help detect rising nitrate concentrations early, but installing and maintaining high-frequency nitrate sensors is expensive. As a result, researchers are exploring whether low-cost water-quality variables (like temperature, dissolved oxygen, and water level) can be used to predict nitrate concentrations instead.
Why traditional monitoring falls short
Monitoring nitrate levels usually depends on in-situ sensors that measure concentration continuously. While highly accurate, they come with several challenges:
- Cost: High-quality sensors cost thousands of dollars each, making large-scale deployment difficult.
- Maintenance: They require frequent cleaning, calibration, and replacement due to fouling.
- Coverage gaps: Many rivers, especially smaller or remote catchments, lack long-term monitoring infrastructure.
Recent research by (Kermorvant et al. 2023) explored whether we can use predictive modelling to assess nitrate concentrations using common, low-cost water-quality measures such as temperature, dissolved oxygen, and water level. If this works, governments and environmental regulatories can monitor nitrate levels and overall water health far more cheaply, contributing significantly to social and environmental benefit.
About the data
The study drew on high-frequency data from the U.S. National Ecological Observatory Network (NEON). Three different sites were analysed:
- Arikaree (CO)
- Caribou (AK)
- Lewis Run (VA)
Each site recorded nitrate and several other (inexpensive to measure) water quality variables every 15 minutes.
| Water quality variable | Description | Unit |
|---|---|---|
| Elevation of surface water | Proxy for flow and rainfall events | Meters above sea level |
| Temperature | Water temperature | °C |
| Specific conductance | Salinity / ionic content | μS/cm |
| Dissolved oxygen | Indicator of biological activity | mg/L DO |
| Turbidity | Cloudiness of water (log-transformed) | FNU |
| Time | Captures seasonal patterns | Minutes |
These variables shown in Table 1 were measured using affordable sensors already common in water-quality programs. Only the nitrate sensor, the most expensive component, was treated as the target variable.
How the model works
To connect these measurements, the researchers built a Generalised Additive Model (GAMM). Put simply, this model allows each variable to have a flexible, curved relationship with nitrates and adjusts for time-based correlation; because yesterday’s river chemistry influences today’s.
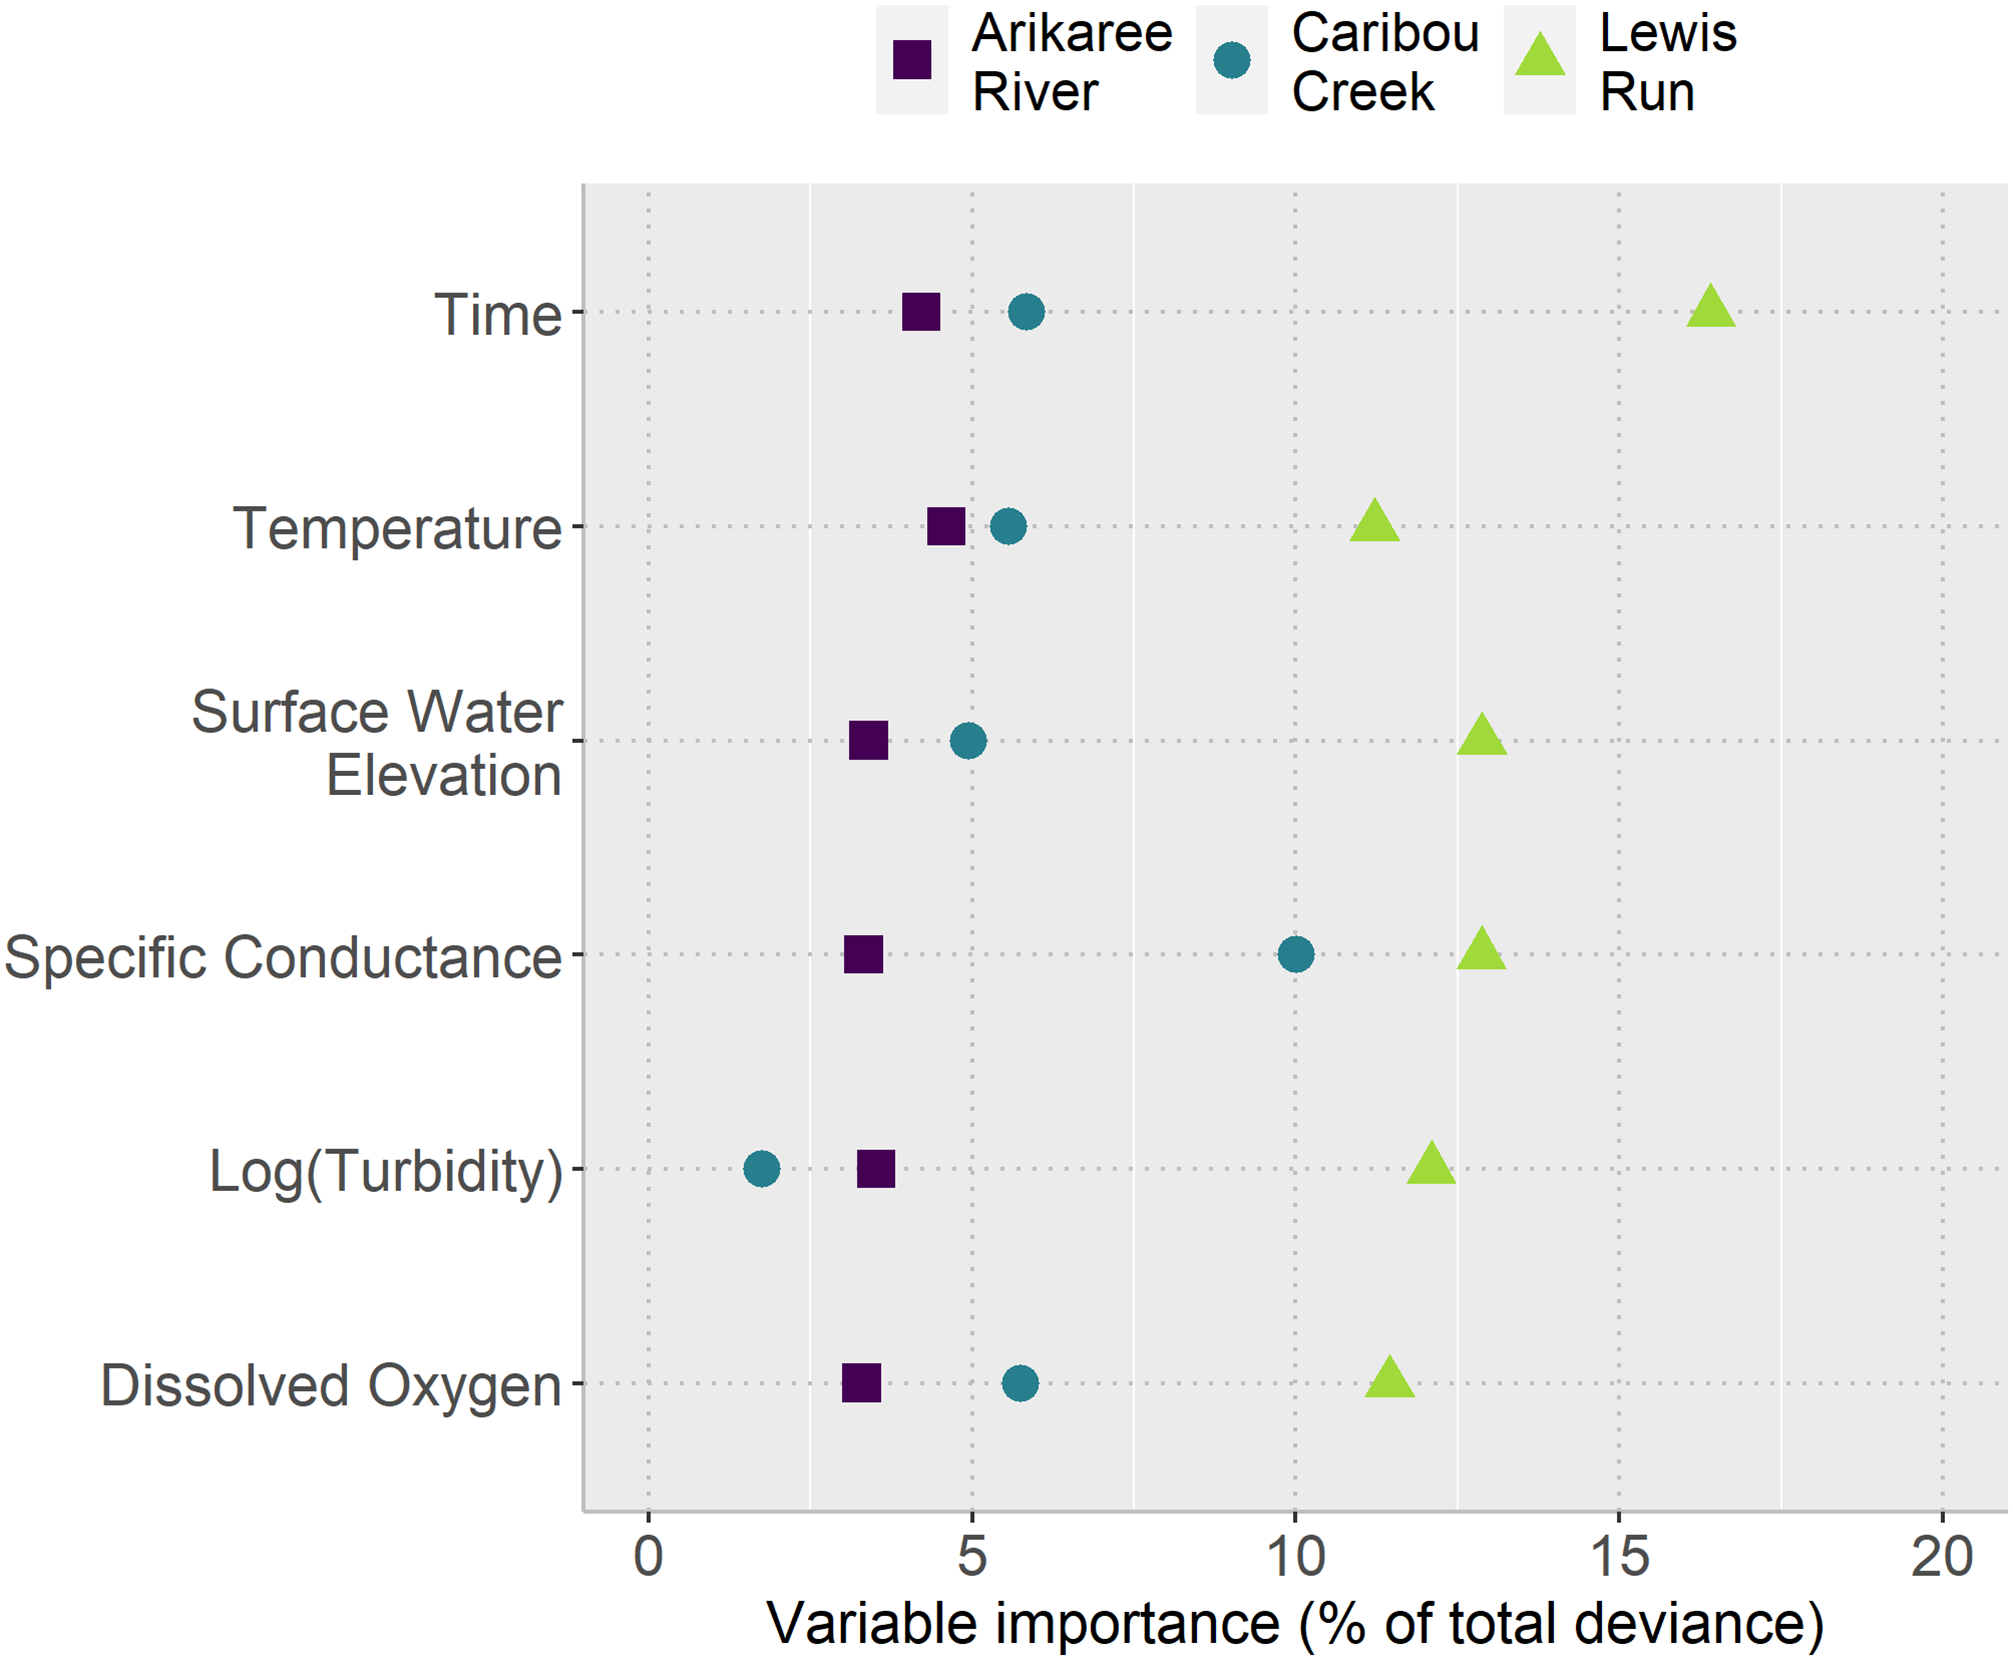
As shown in Figure 1, these six water-quality variables are able to consistently explain variation across all rivers. This shows that the model has significant explanatory power, and variation across sites is due to different agricultural catchments. This consistency means monitoring programs can rely on a standard, low-cost set of indicators instead of expensive nitrate sensors.
What the results showed
The modelling framework achieved over 99% explanatory power for nitrate concentrations across all three sites - an exceptionally strong performance.
This means that once calibrated, the model can be transferred for new locations without starting from scratch; a major efficiency gain for environmental monitoring.
Still, the authors noted a few caveats:
- The models were not designed for prediction far beyond the observed data.
- They relied on continuous data streams, so missing sensor readings could still affect accuracy.
- Local land use (like nearby farms) could change the nitrate–variable relationship over time.
Why this matters
This research demonstrates that a simple, transparent modelling framework can substitute for costly sensor networks without losing insight. For governments, regulatory bodies, and environmental organisations, that’s powerful: similar models can be built and retrained on local data and still perform well.
Beyond water science, it highlights how open data and reproducible analytics can make environmental monitoring more affordable and scalable, creating a lasting impact on climate reslience and sustainable business practices.
Looking ahead
The promise of this work goes beyond water quality. It shows how open data, smart modelling, and reproducible methods can stretch limited environmental budgets further.
If governments and research agencies adopt frameworks like this, they can:
- Monitor more rivers without increasing costs
- Detect pollution events faster, guiding intervention
- Build transparent models that communities and scientists can both trust
In a world facing tighter resources and climate uncertainty, tools like these help us move from reactive cleanup to proactive protection of ecosystems.
💡 Key takeaway
Predictive models powered by open data don’t replace science — they make it more accessible.
By using common water-quality measurements, we can safeguard rivers even where advanced sensors aren’t feasible.
GAI Declaration
I used GAI in the following ways to create this blog: - to help resolve issues in the cross referencing - to create the references.bib file
The link to my AI queries can be accessed here