R/plot.R
plot_tradeoff.Rd
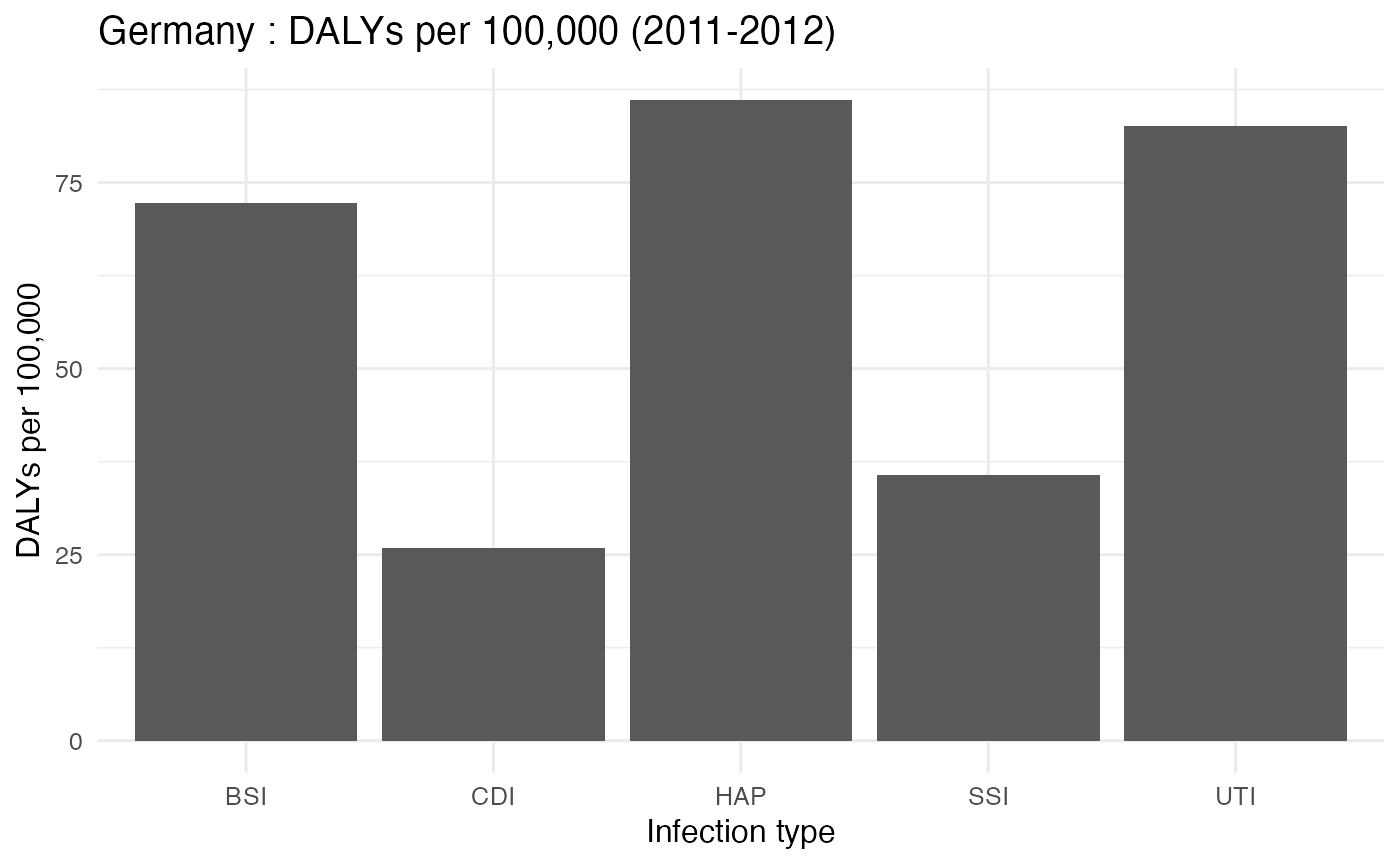
Plot DALYs per 100,000 by infection type
plot_tradeoff(data, region = "Region")
Data frame with columns `hai_type` and `dalys_per100k`.
Character string specifying region name (e.g. "Germany" or "EU/EEA").
A ggplot object showing DALYs by infection type.
plot_tradeoff(asg4::germany_burden, "Germany")