plot_hai_totals(): Visualising HAI totals
Source:vignettes/visualising-hai-totals.Rmd
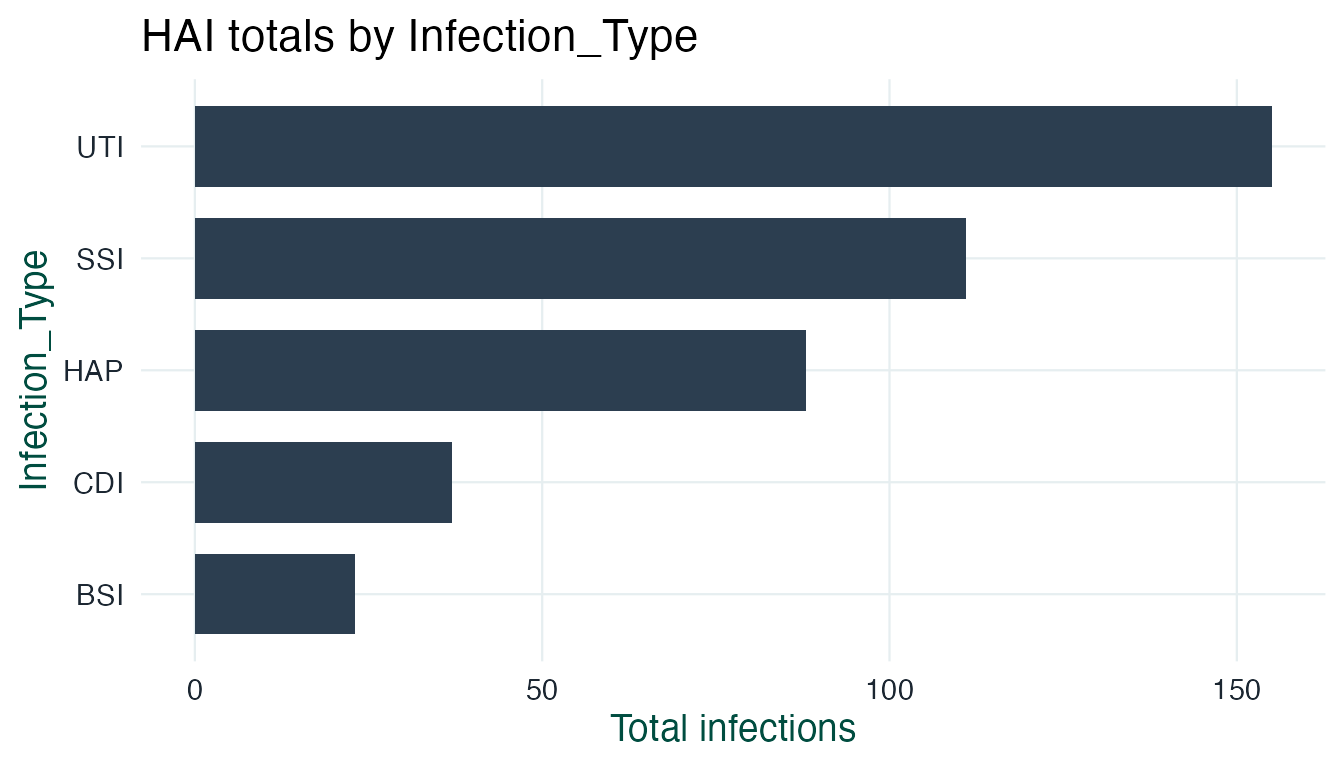
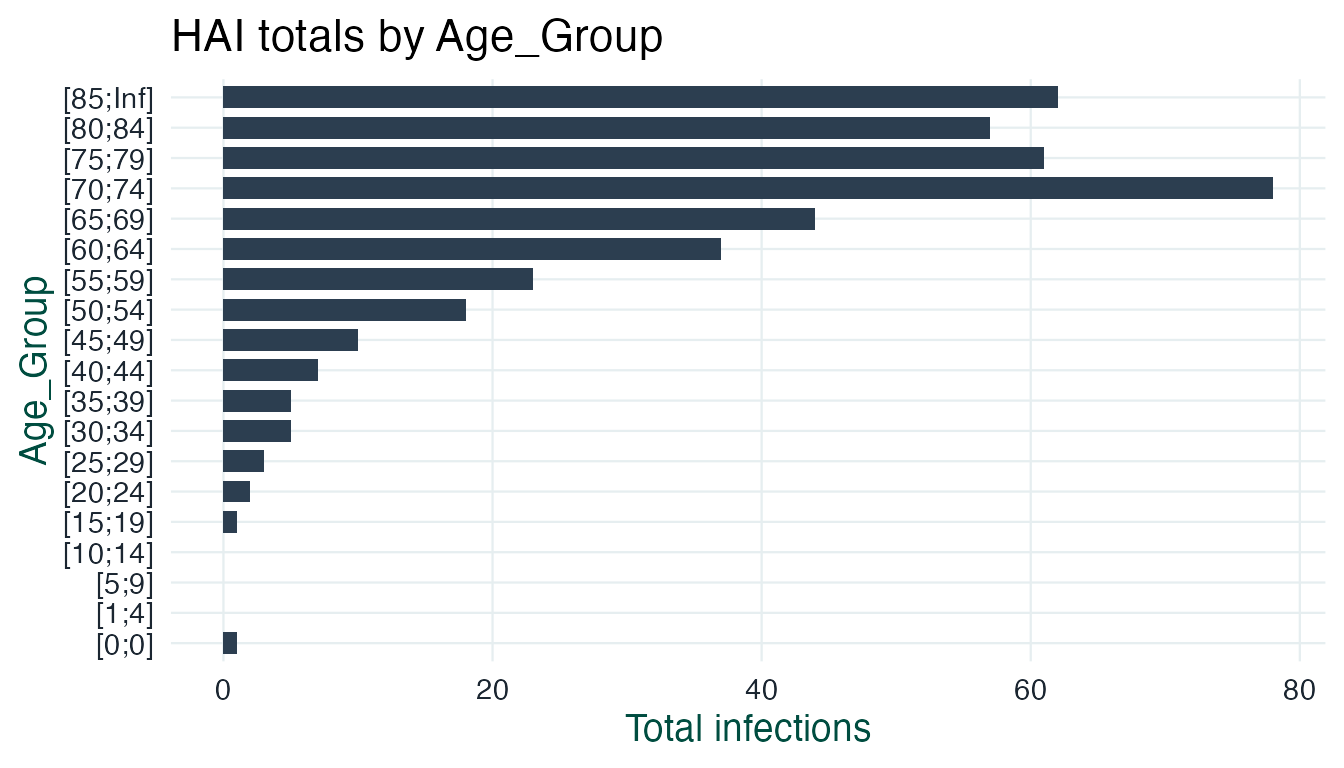
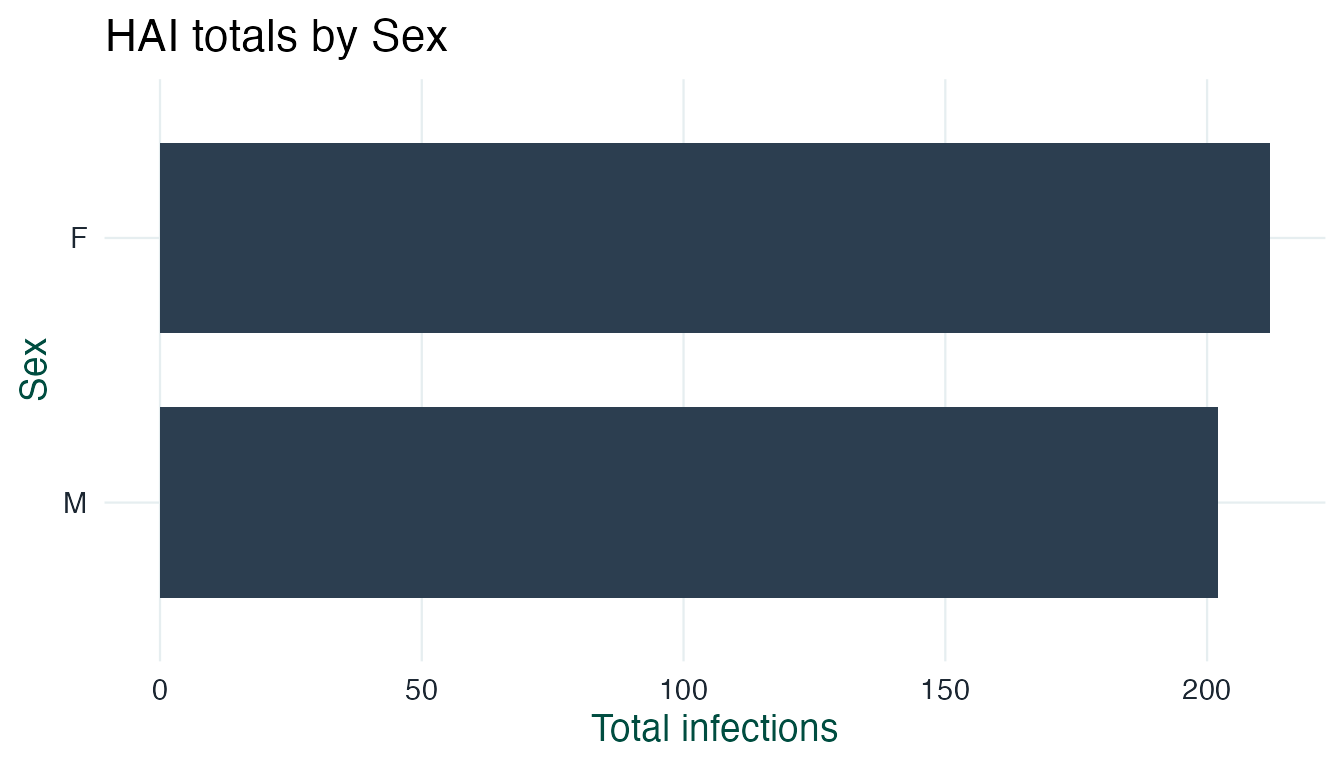
visualising-hai-totals.RmdThis vignette demonstrates plot_hai_totals(), a quick
wrapper around ggplot2 for bar charts of HAI totals by infection type,
age group, or sex.
library(haiInsight)
data("hai_data_clean")
head(hai_data_clean)
## # A tibble: 6 × 4
## Age_Group Sex Count Infection_Type
## <chr> <chr> <int> <chr>
## 1 [0;0] F 0 HAP
## 2 [0;0] M 0 HAP
## 3 [1;4] F 0 HAP
## 4 [1;4] M 0 HAP
## 5 [5;9] F 0 HAP
## 6 [5;9] M 0 HAP