assignment4packages: Exploring Common Names
Trisha Aurielle Andrea
2025-10-19
Source:vignettes/assignment4packages-demo.Rmd
assignment4packages-demo.Rmd
remotes::install_github("ETC5523-2025/assignment-4-packages-and-shiny-apps-trishaandrea")
csv_path <- system.file(
  "extdata",
  "adjusted-name-combinations-list.csv",
  package = "assignment4packages"
)

names_data <- read.csv(csv_path, check.names = FALSE)
head(names_data)
#>     FirstName Surname Adjustment       cleanName Estimate finalEstimate
#> 1 1     James   Smith       21.1     james smith 25837.93      31289.74
#> 2 2   Michael   Smith        5.6   michael smith 29275.91      30915.36
#> 3 3    Robert   Smith        8.7    robert smith 24005.22      26093.67
#> 4 4     David   Smith       10.8     david smith 22613.77      25056.06
#> 5 5     James Johnson        9.6   james johnson 20498.04      22465.86
#> 6 6   Michael Johnson       -4.8 michael johnson 23225.50      22110.68
names_data <- names_data[, nzchar(names(names_data)), drop = FALSE]
colnames(names_data)
#> [1] "FirstName"     "Surname"       "Adjustment"    "cleanName"
#> [5] "Estimate"      "finalEstimate"
summarize_data(names_data)
#>   Adjustment Estimate finalEstimate
#> 1    0.58425 6602.107      6426.914
Visualise the most common first names in the dataset.
library(dplyr)
library(ggplot2)
top10 <- names_data |>
select(FirstName, Estimate) |>
filter(!is.na(FirstName), !is.na(Estimate)) |>
arrange(desc(Estimate)) |>
slice_head(n = 10)
ggplot(top10, aes(x = reorder(FirstName, Estimate), y = Estimate)) +
geom_col() +
coord_flip() +
labs(
x = "First name",
y = "Estimate (count / frequency)",
title = "Top 10 first names by Estimate"
)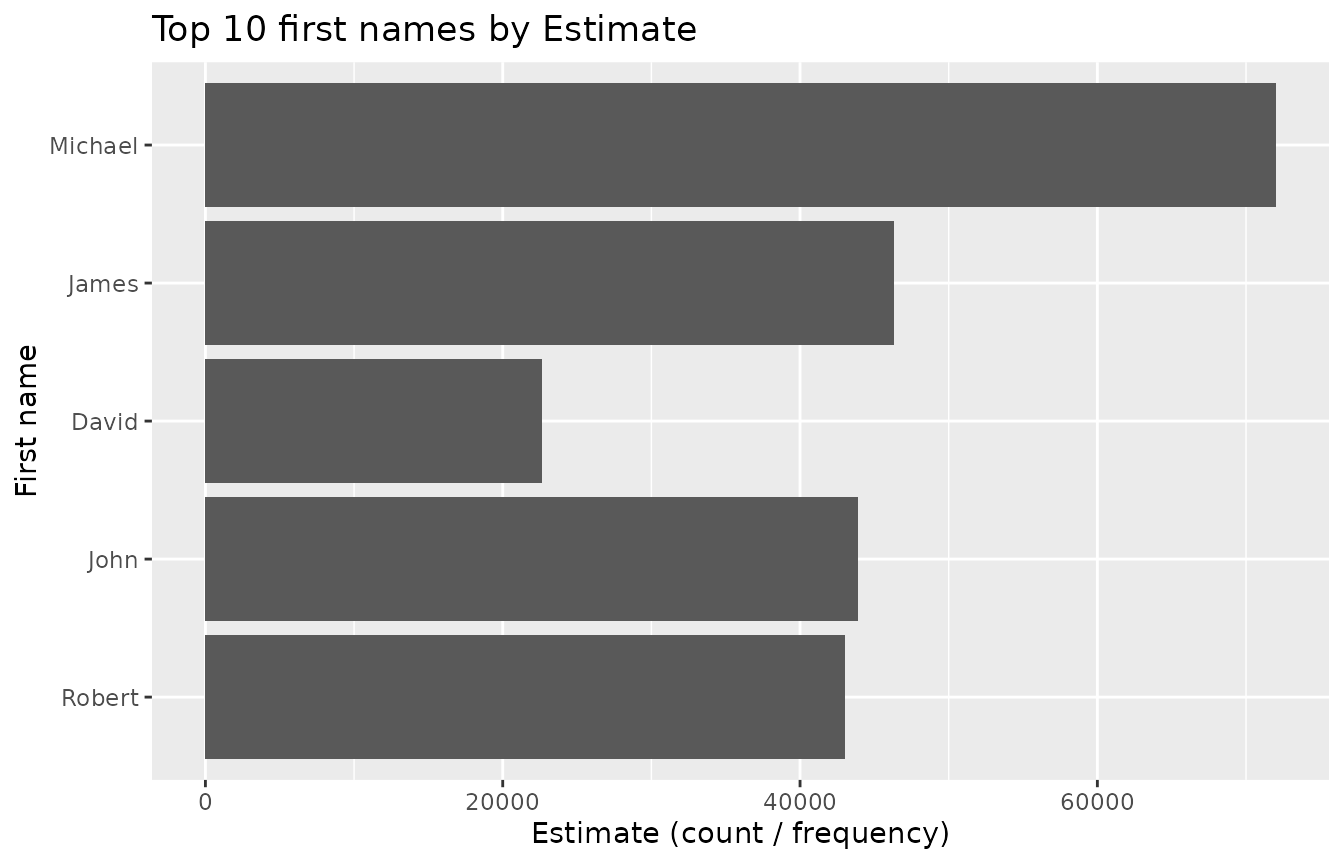 How to interpret: Taller bars indicate names that appear more frequently
according to the chosen count column. Try switching to finalEstimate if
you prefer the adjusted totals.
How to interpret: Taller bars indicate names that appear more frequently
according to the chosen count column. Try switching to finalEstimate if
you prefer the adjusted totals.
if (interactive()) {
  run_app()
}
sessionInfo()
#> R version 4.5.1 (2025-06-13)
#> Platform: x86_64-pc-linux-gnu
#> Running under: Ubuntu 24.04.3 LTS
#>
#> Matrix products: default
#> BLAS:   /usr/lib/x86_64-linux-gnu/openblas-pthread/libblas.so.3
#> LAPACK: /usr/lib/x86_64-linux-gnu/openblas-pthread/libopenblasp-r0.3.26.so;  LAPACK version 3.12.0
#>
#> locale:
#>  [1] LC_CTYPE=C.UTF-8       LC_NUMERIC=C           LC_TIME=C.UTF-8
#>  [4] LC_COLLATE=C.UTF-8     LC_MONETARY=C.UTF-8    LC_MESSAGES=C.UTF-8
#>  [7] LC_PAPER=C.UTF-8       LC_NAME=C              LC_ADDRESS=C
#> [10] LC_TELEPHONE=C         LC_MEASUREMENT=C.UTF-8 LC_IDENTIFICATION=C
#>
#> time zone: UTC
#> tzcode source: system (glibc)
#>
#> attached base packages:
#> [1] stats     graphics  grDevices utils     datasets  methods   base
#>
#> other attached packages:
#> [1] ggplot2_4.0.0                  dplyr_1.1.4
#> [3] assignment4packages_0.0.0.9000
#>
#> loaded via a namespace (and not attached):
#>  [1] gtable_0.3.6       jsonlite_2.0.0     compiler_4.5.1     tidyselect_1.2.1
#>  [5] jquerylib_0.1.4    systemfonts_1.3.1  scales_1.4.0       textshaping_1.0.4
#>  [9] yaml_2.3.10        fastmap_1.2.0      R6_2.6.1           labeling_0.4.3
#> [13] generics_0.1.4     knitr_1.50         tibble_3.3.0       desc_1.4.3
#> [17] bslib_0.9.0        pillar_1.11.1      RColorBrewer_1.1-3 rlang_1.1.6
#> [21] cachem_1.1.0       xfun_0.53          fs_1.6.6           sass_0.4.10
#> [25] S7_0.2.0           cli_3.6.5          pkgdown_2.1.3      withr_3.0.2
#> [29] magrittr_2.0.4     digest_0.6.37      grid_4.5.1         lifecycle_1.0.4
#> [33] vctrs_0.6.5        evaluate_1.0.5     glue_1.8.0         farver_2.1.2
#> [37] ragg_1.5.0         rmarkdown_2.30     tools_4.5.1        pkgconfig_2.0.3
#> [41] htmltools_0.5.8.1